

TL;DR and context
A nine-step scientific marketing email process, based on our experiment in which problem-led emails beat statistics-led ones on open rate by 10.8 points.
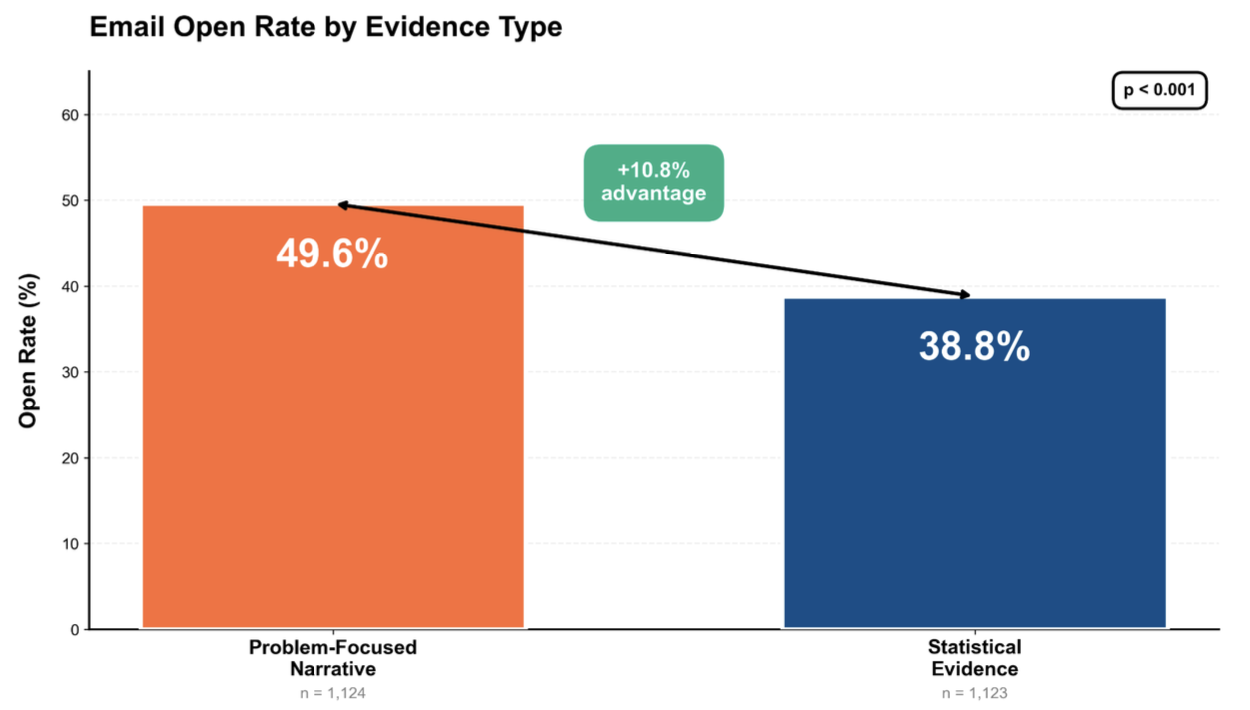
- In a randomised experiment involving 2,247 life sciences professionals, 49.6% of recipients opened first emails that led with a lab problem, compared with 38.8% for emails that led with validation statistics.
- This guide turns that result into a working process for scientific marketing teams, from collecting customer language and scoring a researcher list to subject lines, follow-ups, measurement and a cleaner test.
- Anything that goes beyond what the experiment measured is marked as practice.
Read the study behind this guide, What makes someone open a cold email?
Scientific marketing runs on proof. Product pages carry validation data, application notes and citations, and the reflex is to lead a cold email with the strongest figure available. A researcher scanning her inbox sees the subject line before she sees the evidence inside. In the experiment, emails that led with a question about a familiar lab problem had an open rate about 11 percentage points higher than those that led with a number. The gap held across all four campaign pairings in the US and EU. The statistic may still earn its place later, once a buyer is comparing suppliers, though the experiment did not test that.
This guide is for life sciences email marketing teams, growth teams and salespeople selling research tools, reagents, instruments, services or software to laboratories. About two-thirds of the researchers in the study worked at universities, 28% worked in industry and 5% worked in government labs. Those selling to clinicians, regulators or procurement departments should read the limits section before copying anything.
Sort your last ten cold email campaigns into two groups. Put subject lines that led with a number or validation term in one group and those that led with the reader’s situation in the other. Compare their open rates. Lists and timing will differ, so treat what you see as a hypothesis to test.
Then check the size of the list. To detect an open-rate gap of the size seen in the experiment, aim for about 660 contacts per segment, split into two groups of about 330.
| Gap to detect | Recipients per version | Total for a two-way test |
|---|---|---|
| Open rate, 38.8% to 49.6% | about 330 | about 660 |
| Click rate, 1.4% to 3.0% | about 1,300 | about 2,600 |
Industry averages are a rough guide. Woodpecker puts average cold email open rates between 27.7% and 44%, and Instantly puts the average reply rate at 3.43%, with top-quartile campaigns at 5.5%. Both are self-reported platform figures. The study list was filtered to recently engaged contacts. Compare your two versions with each other, since industry averages cover different lists.
Step 1. Collect the customer’s language
Use the words customers use to describe the problem. Pull the notes from your last 20 sales calls, your last 20 support tickets and any discovery interviews. Highlight every sentence in which a customer describes something going wrong. In a spreadsheet, record each phrase, how often it recurs and the speaker’s role. Keep the ten most frequent phrases and drop any that only your team uses.
Teams without calls or tickets can mine forums, review sites, protocol troubleshooting sections and the discussion sections of papers, where frustrations surface as workarounds. Practice, not study data.
Step 2. Build and score the list
You can use the study’s list-building process with a smaller list. Build three sets of keywords covering the core technology, the problem and the outcome. Rank a researcher who has published on both the technology and the problem above one who has published only on the technology. Require a verified current affiliation, relevant research interests and some sign of email engagement, such as an opened professional message in the past six months. Strip duplicates, invalid addresses and past unsubscribers. Contact data tools can fill gaps, and our comparison of Apollo and Hunter sets out what each costs.
| Factor | Weight |
|---|---|
| Publication 2023 to 2025 | 1.0 |
| Publication 2021 to 2022 | 0.6 |
| Publication 2020 or earlier | 0.3 |
| First or corresponding author | 1.0 |
| Middle author | 0.4 |
| Senior title | Highest weight |
| Journal impact | Modest weight |
The experiment used separate segments for academia, pharma and biotech, and contract research. It added a regulatory and alternative methods segment for one product. For each segment, describe the problem using the phrases you collected in Step 1.
Step 3. Write problem-led subject lines
Name what goes wrong, where it goes wrong and what it costs.
| Number-led | Problem-led |
|---|---|
| Validated assay with a 95% success rate across runs | Is assay variability slowing down your screening? |
| 99% purity, lot-to-lot consistency | Does lot-to-lot variation keep forcing you to repeat runs? |
| Cuts sample prep time by 40% | How many hours of sample prep did you lose this week? |
| Peer-reviewed protocol, 12 citations | Still troubleshooting a protocol that worked last month? |
Each line should describe something the reader has lived through, carry at most one number and make sense in under two seconds. In the experiment, subject lines were 8 to 15 words long, with the main idea in the first 40 characters. A phone inbox may show only 30 to 40 characters.
Step 4. Write the email
The problem-led emails in the experiment were 150 to 300 words long and followed the order below.
| Lines | Job | In the experiment |
|---|---|---|
| 1 | One sentence on the recipient’s recent work, specific enough that it could go to nobody else | A reference to a recent publication, identical in both versions |
| 2 to 3 | The problem, in two or three short sentences of customer language | “Inconsistent results. Readings that vary from run to run.” |
| 4 to 5 | The cause, in terms the reader recognises and you can substantiate | Why standard set-ups produce the problem |
| 6 to 7 | The fix, as the answer to that cause, with one concrete outcome and no spec sheet | The product as the answer to the cause |
| Last | One call to action | “Want to see the protocol and hear how other groups solved this?” |
Both versions in the experiment linked to the same validation material, so the proof was always one click away. Send from a named person, in plain text with light formatting.
Step 5. Prepare the send
Check delivery before reading anything into the response. For the experiment, we warmed the sending domains for four weeks, starting at about 50 emails a day, and authenticated them with SPF, DKIM and DMARC. We sent on weekdays during recipients’ local working hours, avoided academic holidays and big conferences, and put sender identification and a working unsubscribe link in every message. We emailed US and EU contacts in separate segments on different platforms, so compare gaps within a region, never raw rates across regions.
European rules on business cold email differ by country.
| Market | Business cold email in practice |
|---|---|
| EU baseline | GDPR legitimate interest (Article 6(1)(f)) can cover the data processing, but national e-privacy law decides whether the email itself needs consent |
| France | Permitted without prior consent when the message relates to the recipient’s profession, with an easy opt-out |
| Germany | Prior consent generally required for advertising email, even between businesses |
| United States | CAN-SPAM rules on honest headers, a postal address and a working opt-out |
Step 6. Follow up
In the experiment, non-responders got one follow-up three to five days later, in the same style but on a different symptom of the problem or a different data point. The sequence below builds on it.
| Send | Timing | Content |
|---|---|---|
| 1 | Day 0 | Problem-led email from Step 4 |
| 2 | Day 3 to 5 | Same style, a different symptom of the same problem, shorter |
| 3 | Day 8 to 10 | A short example of how another lab handled it, one link |
| 4 | After the reader asks for validation material | The detailed validation material the reader asked for |
The fourth send only goes to readers who ask for the validation material, so the proof arrives when they want it.
Step 7. Measure beyond the open
Raw opens are now a weak signal. Apple Mail Privacy Protection loads tracking pixels whether or not anyone reads the message, and Apple clients accounted for 49.29% of email opens in January 2025, according to Litmus. Security scanners add more phantom opens and clicks. The experiment excluded opens generated by Apple’s privacy feature and by scanners. We identified scanner opens by near-instant timing, repeated patterns from one IP address and known scanner user agents.
Count unique opens and clicks over a fixed window. Divide each count by the number of delivered emails. The experiment used a 72-hour window for opens. Then add replies, meetings and qualified leads, since the experiment stopped at the click. The Wine Access email test shows how to judge copy on gross profit instead of clicks. Log which version each contact received so you can follow them down the funnel.
Step 8. Separate the subject line from the body
The experiment changed the subject line, opener and structure together, so it cannot isolate the effect of the subject line. A randomised two-by-two test can estimate the effects of the subject line and body separately.
| Subject and body | Problem-led body | Statistics-led body |
|---|---|---|
| Problem-led subject | A | B |
| Statistics-led subject | C | D |
Compare A and C with B and D to isolate the body, and A and B with C and D to isolate the subject. Hold the sender, first line, offer, length and send time constant, and randomise within each segment. The experiment used a pseudo-random generator seeded by contact ID, which makes the split reproducible. Four versions need twice the list of two.
Step 9. Model the response
If the study’s rates held across 10,000 delivered emails, the two versions would produce the results below.
| Per 10,000 delivered | Problem-led | Statistics-led | Difference |
|---|---|---|---|
| Opens | about 4,960 | about 3,880 | about 1,080 more |
| Clicks | about 300 | about 140 | about 160 more |
Multiply the extra clicks by your click-to-meeting and meeting-to-sale rates to estimate additional sales. Multiply that estimate by your average gross profit per sale, then subtract any additional campaign costs.
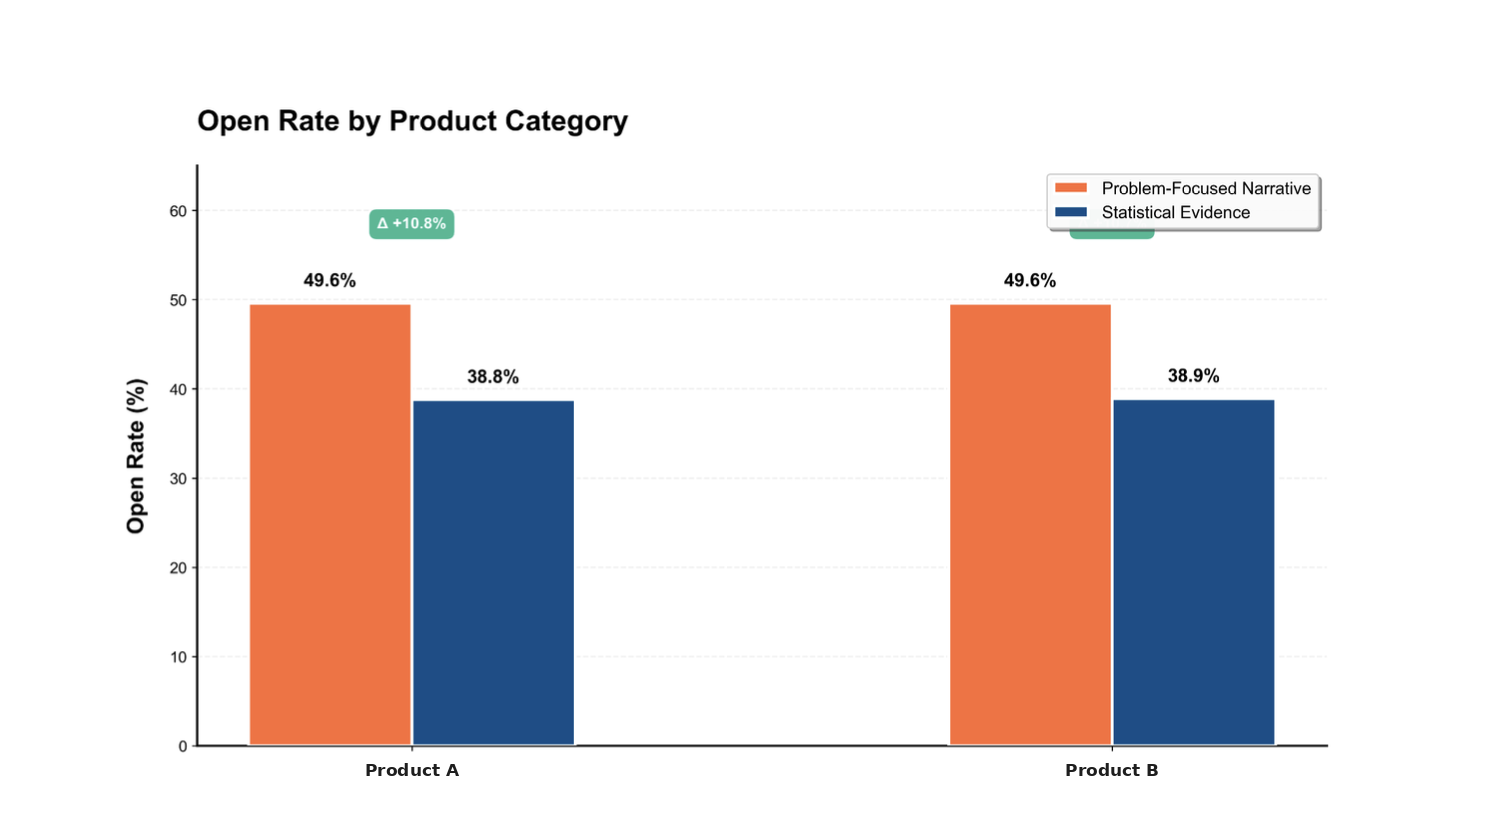
The charts show the overall result and the split between the two product lines. One product was for regulated safety testing and the other addressed a common bench-method problem.
Limits of the framework
The experiment measured opens and clicks. Whether problem-led emails won more customers is unknown. The recipients were life sciences researchers. Clinical, regulatory and purchasing audiences may respond differently. Run a small version of the test on your list before moving a whole programme to problem-first framing, since the open signal arrives within 72 hours.
Pre-send checklist
- Does the subject line describe the reader’s situation, with at most one number?
- Does the framing land within the first 40 characters?
- Could the first line only have been written for this person?
- Are the problem phrases taken from real customer language?
- Is there one call to action, with validation material one click away?
- Is the message between 150 and 300 words?
- Is the sender a named person, with a working unsubscribe link?
- Does the target market allow business cold email without consent?
- Is the version logged against the contact?
- Is the sample large enough for the question being asked?
Related analysis
The companion study gives the full findings, limits and European breakdown. For another measured follow-up experiment, see Fischer Future Heat texted week-old leads with AI and booked 105 home surveys, and for a randomised test of retention messaging, The policy video that kept more customers after a price rise.
FAQ
What is a problem-led scientific marketing email?
One that opens with a frustration the researcher recognises, explains its cause, offers the product as the fix and gives one next step, with validation data a click away. In the experiment, these emails were 150 to 300 words long.
How many contacts do I need to test subject lines?
About 330 per version to detect an open-rate gap of 10.8 percentage points and about 1,300 per version to detect a change in click rate from 1.4% to 3.0%, at 80% power and 5% significance.
How should I follow up with researchers?
In the experiment, we sent one follow-up three to five days later in the same style, focusing on a different symptom of the problem. The third and fourth emails in this guide are suggested practice.
Is cold email to researchers legal in Europe?
It depends on the country. France permits business prospecting by email when it relates to the recipient’s profession, while Germany generally requires prior consent even between businesses. Check each market before sending.
Does the guide prove problem-led emails win sales?
No. The experiment measured opens and clicks, not meetings or sales.
Spotted an error? Write to corrections@industrycontents.com.