
Experiment summary
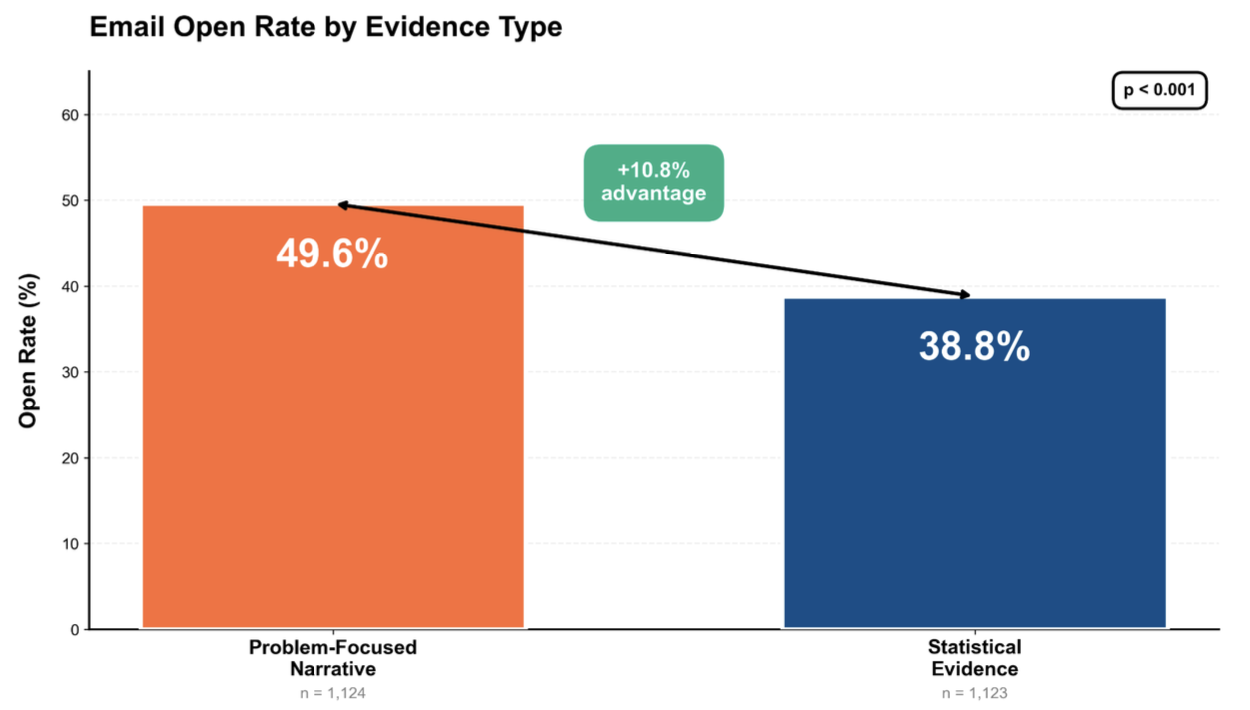
In our cold email open rate test with 2,247 researchers, problem-led first emails were opened 49.6% of the time and statistics-led ones 38.8%.
- We ran a randomised experiment on cold email open rates with 2,247 life sciences professionals in the US and EU from August to September 2025.
- Recipients opened 49.6% of first emails that led with their problem and 38.8% of those that led with a performance statistic. The gap was 10.8 percentage points, a relative increase of about 28%.
- The problem-led version won all four campaign pairings, by 10.4 to 11.2 percentage points, in both regions and for both products. Clicks pointed the same way, 3.0% against 1.4%, based on about 50 clicks in total.
A common approach to cold email rests on a simple theory. A stranger owes the sender nothing, so the sender must earn belief before asking for attention, and the quickest way to earn belief is with a number. That’s how you get first messages that lead with a 40% saving, a 95% success rate or a wall of client logos.
We tested that theory with research scientists, who regularly weigh claims against validation data. We expected the statistic to win with this audience.
In the same week, we sent researchers emails with two kinds of subject line. One announced a validated assay with a 95% success rate. The other asked, “Is assay variability slowing down your screening?” The email with the question had an open rate roughly 11 percentage points higher.
From August to September 2025, we ran eight cold email campaigns with 2,247 verified life sciences professionals, including 1,247 in the US and 1,000 in the EU. About two-thirds worked at universities, 28% in industry and 5% in government laboratories. The emails promoted two research tools made by a life sciences company based in France.
We selected recipients from publication records dated 2020 to 2025, institutional directories and laboratory websites. To qualify, recipients had to have opened a professional email in the previous six months. Within each region, we randomly assigned each recipient to one version of the first email.
The statistics-led version opened with a performance claim and a citation, listed specifications in bullet points and offered the full validation dataset. The problem-led version opened with a frustration a researcher would recognise (“Inconsistent results. Readings that vary from run to run.”), explained the cause, offered the product as the fix and promised a protocol and examples from other labs. We used the same send window for both versions. Both came from the same named sender, used the same personalised first line about the recipient’s recent publication, were 150 to 300 words long and linked to the same validation material.
| Element | Problem-led email | Statistics-led email |
|---|---|---|
| Subject line | A question about a lab frustration | A declarative performance claim |
| Opening | The problem, in the researcher’s words | A figure and a citation |
| Body | Cause, then the product as the fix | Specifications in bullet points |
| Call to action | See the protocol and how other labs solved it | View the complete validation dataset |
| Held constant | Sender, personalised first line, length, subject line length, validation link, send window | |
Cold email open rate was higher for problem-led emails in every pairing
The problem-led emails were opened by 558 of 1,124 recipients, or 49.6% (95% confidence interval 46.7% to 52.5%). The statistics-led emails were opened by 436 of 1,123, or 38.8% (36.0% to 41.6%). The intervals do not overlap. That’s about one extra open for every nine delivered emails. The continuity-corrected chi-square statistic was 26.2 (p < 0.001). The effect size was small to medium (Cohen’s h = 0.22).
The gap varied little by region or product. US recipients opened both versions at higher rates than EU recipients, but the gap between versions was nearly the same in both regions. The same held for each product line, one used in heavily regulated safety testing and the other aimed at a common bench-method problem. We expected validation data to carry more weight in the regulated setting, but the gap was similar for both products.
| Segment | Problem-led | Statistics-led | Gap (percentage points) |
|---|---|---|---|
| All recipients | 49.6% | 38.8% | 10.8 |
| US | 51.8% | 41.1% | 10.7 |
| EU | 47.0% | 36.0% | 11.0 |
| Product A (regulated application) | 49.6% | 38.8% | 10.8 |
| Product B (bench method) | 49.6% | 38.9% | 10.7 |
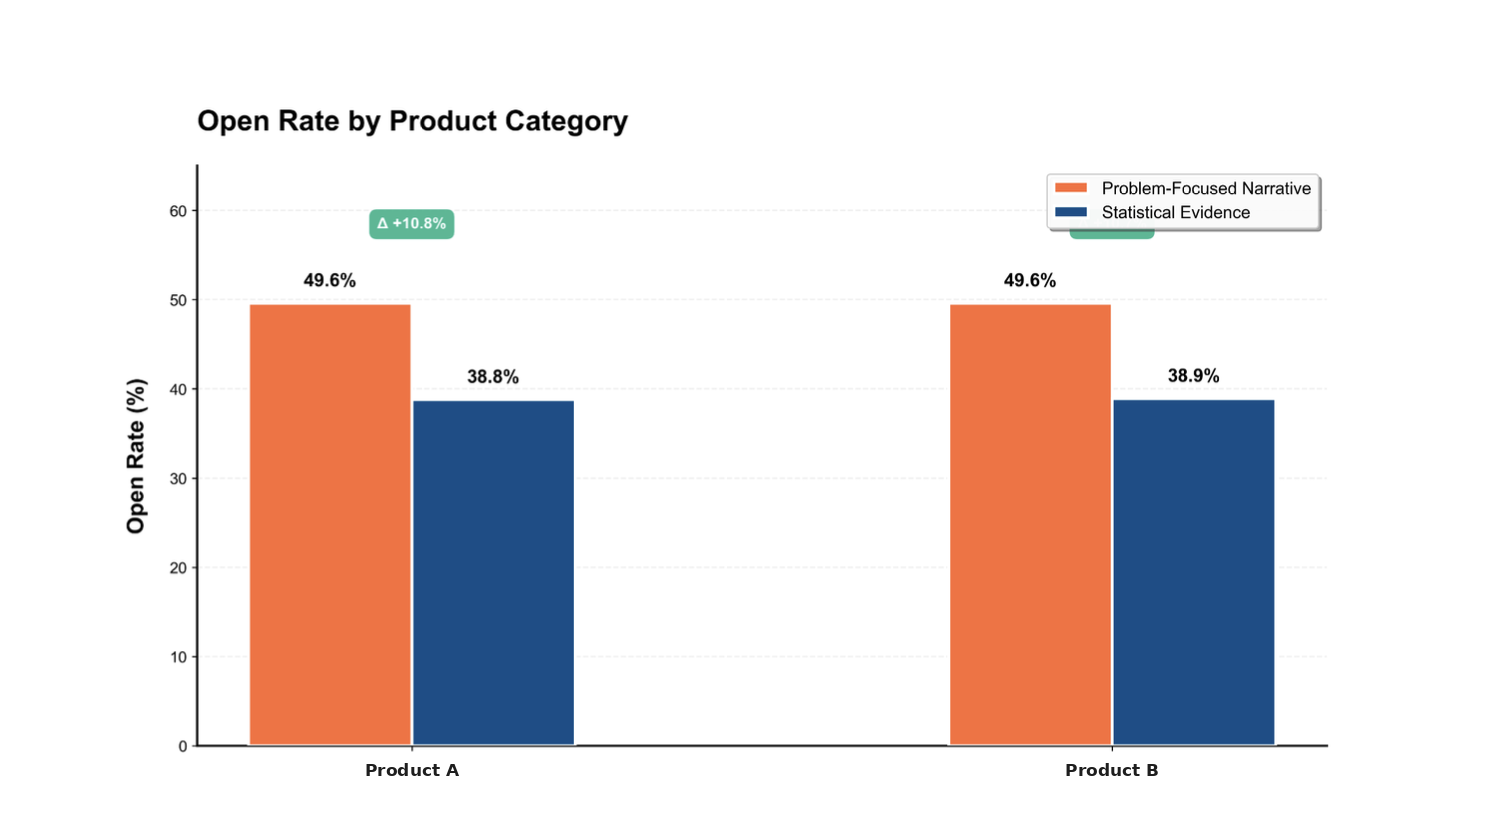
Across the four campaign pairings, the gap ranged from 10.4 to 11.2 percentage points.
Clicks pointed the same way. The click rate was 3.0% for problem-led emails and 1.4% for statistics-led emails, roughly 34 clicks versus 16. The pattern held for each product (3.0% against 1.2% for one, 3.0% against 1.6% for the other). With about 50 clicks in total, the difference gives an early indication of which version drew more clicks. Its size is uncertain.
Open rates in the study ranged from 36% to 52%. Published cold email benchmarks come mostly from sending platforms themselves. Woodpecker, a sending platform, puts the average cold email open rate somewhere between 27.7% and 44%, depending on the source and on how many machine opens are counted. Instantly, another sending platform, reports an average reply rate of 3.43%, a different measure. Both figures are self-reported by the platforms.
Two details matter when comparing these rates with benchmarks. The list was filtered to people who had recently opened professional email and weighted towards senior and lead authors. Apple’s Mail Privacy Protection loads tracking pixels on a proxy server whether or not anyone reads the message, and Apple clients accounted for 49.29% of email opens in January 2025, according to Litmus. We excluded opens attributed to Apple Mail Privacy Protection and to security scanners that fire within seconds of delivery. The absolute rates therefore describe this list and should not be used as a benchmark. Because both styles went to the same filtered list, the gap between them is the number to compare.
Sales teams already argue about questions in subject lines, and their data disagree. Yesware, an email tracking firm, found that question subject lines in 1.2 million cold emails drew about 10% more opens than average. BuzzStream, an outreach tool, found the reverse in its pitches to journalists, with subject lines that stated a finding opened 43.1% of the time against 39.8% for those that teased or asked.
Both studies are observational. Their results can reflect differences in who received the emails as well as differences in the subject lines. It is the same weakness the Industry Contents Data Lab audit of growth case studies found in 19 of 51 published experiments. We randomly assigned recipients from the same filtered list to the two versions.
Attention first, proof later
An email is opened before its body is read. The decision rests on the sender, the subject line and the preview text, and the sender was held constant. The subject line and preview text could both have influenced opens. The subject lines also differed in three ways at once. The problem-led lines were questions, carried almost no numbers and used plain, emotional words such as “tired” and “slowing down”. The statistics-led lines were assertions that led with figures and leaned on words like “validated” and “peer-reviewed”.
The two styles overlapped. Every statistics-led email included some narrative, and every problem-led email included some data.
Persuasion research gives statistics an advantage on some measures. A 1997 meta-analysis by Mike Allen and Raymond Preiss of 15 studies found statistical evidence slightly more persuasive than stories. A 2015 meta-analysis drew a finer line. Statistics moved beliefs and attitudes more, while narratives moved intentions more.
That split fits the inbox. Buyers can weigh statistics when comparing suppliers. In the inbox, the reader has seconds to decide whether to open an email, and opening it carries no commitment. A claim of “95% success” raises questions (under what conditions, compared with what?) that take longer to answer than the moment allows.
The research literature suggests two further explanations. We tested neither here. A message dense with specifications can look like a sales pitch, and readers who spot a pitch may discount it. And a statistic that sets a new method against the old one can imply that the reader’s current method falls short, while naming the problem can acknowledge an obstacle the reader faces. Validation data may matter more when scientists are evaluating a product. At first contact, the reader is deciding whether to open the message.
We have no country-level breakdown for the 1,000 EU recipients, so the study cannot estimate separate results for France, Germany or Poland. European open rates were lower in both arms, but the regions used different sending platforms (Brevo in Europe, Smartlead in America), so the meaningful comparison is the gap within each region.
The European contacts were emailed under the GDPR’s legitimate-interest basis (Article 6(1)(f)), with sender identification and a working unsubscribe link in every message. National rules on the email itself vary. France permits business prospecting by email without prior consent when the message relates to the recipient’s profession. Germany’s unfair-competition law generally requires prior consent for advertising email even between businesses, as Fieldfisher’s survey of EU e-marketing rules sets out. Firms copying the design should check each market first.
These are four changes to test. The study compared complete email versions.
| Change | Evidence behind it |
|---|---|
| Lead the cold email subject line with the reader’s problem, phrased as a question | Part of the version with the higher open rate. The subject line’s separate effect was unmeasured. |
| Open the body with two or three sentences on that problem, in customers’ words | Part of the version with the higher click rate. The opening’s separate effect was unmeasured. |
| Keep the middle short and hint at the fix without the full technical case | Untested |
| Offer one next step, with the proof one click away | Untested |
The experiment also points to a staged use of evidence, with problem language at first contact and detailed validation saved for buyers who are actively evaluating. That is a hypothesis, not a result. Teams that let AI write first messages at volume face the same choice, as our analysis of AI sales prospecting sets out. The templates, list scoring and a two by two design that separates the subject line from the body are in the guide to writing a cold email to a scientist.
Nothing here suggests that scientists have stopped deciding on evidence. We measured an earlier decision, whether the reader opened the email. In every pairing, the problem-led email was opened more often. The next test is whether readers still ask for the validation table before signing a purchase order and whether leading with the problem speeds up or slows down that purchase.
Methodology
Industry Contents designed this randomised field experiment, ran it with practising researchers in Europe and the United States, and analysed the results. Subject lines quoted here are lightly edited.
Contacts were identified with a custom tool that queried publication databases and matched results to institutional directories and laboratory pages. Eligibility also required a verified current affiliation and research interests in the relevant fields. Duplicates, invalid addresses and earlier unsubscribers were removed. Assignment used a pseudo-random generator seeded by participant ID, applied separately to the American and European segments.
We sent emails on weekdays during recipients’ local working hours from domains warmed for four weeks and authenticated with SPF, DKIM and DMARC. Subject lines in both groups were 8 to 15 words long. Non-responders received one follow-up three to five days later in the same style. Recipients read mail mainly in Gmail (about 45%), Outlook (about 35%) and Apple Mail (about 15%).
We calculated open rates by dividing unique opens recorded within 72 hours of sending by delivered emails. Click rate is unique clicks divided by delivered emails. Scanner opens were identified by near-instant timing, repeated patterns from one IP address and known scanner user agents. The delivery rate was 99.4%. The analysis covered 2,247 recipients after we excluded undeliverable addresses and hard bounces. Differences were tested with chi-square and Fisher’s exact tests. We applied a continuity correction to the chi-square statistic for the overall open-rate comparison. We report effect size as Cohen’s h. With eight campaigns, subgroups were compared descriptively and no formal model was fitted. Regional figures come from the campaign export. Analysis code is available on request.
How to cite this study. Industry Contents (2026). What makes someone open a cold email? Our test with 2,247 researchers. industrycontents.com/cold-email-open-rate-study/
Sources
- Industry Contents research, randomised cold email experiment, August to September 2025, campaign exports from the sending platforms
- Allen and Preiss, Comparing the persuasiveness of narrative and statistical evidence using meta-analysis, Communication Research Reports, 1997
- Zebregs and others, The differential impact of statistical and narrative evidence on beliefs, attitude and intention, Journal of Health Communication, 2015
- Fieldfisher, EU e-marketing requirements, January 2024
- Woodpecker, Instantly, Yesware and BuzzStream benchmark data as linked in the text, self-reported by the platforms
FAQ
What makes someone open a cold email?
In our experiment with 2,247 research professionals, first emails that led with the reader’s problem were opened 49.6% of the time, against 38.8% for first emails that led with a performance statistic.
Does the result apply outside science?
This experiment covered life sciences professionals. Other audiences may respond differently, so test both versions with your own list.
Did the experiment measure sales?
No. It measured opens within 72 hours and clicks, about 50 in total. Meetings and sales were not tracked.
Are these open rates a cold email benchmark?
No. The list was filtered to recently engaged contacts and machine opens were removed. The 36% to 52% range describes this sample. The gap between the two styles is the finding.
Did the result hold in Europe?
Yes. The gap was 11.0 percentage points in the EU and 10.7 in the US. The EU sample has no country split, and national rules on business cold email differ.
Spotted an error? Write to corrections@industrycontents.com.
Compare more measured experiments in the Signal Index or browse the Growth Signal archive.