
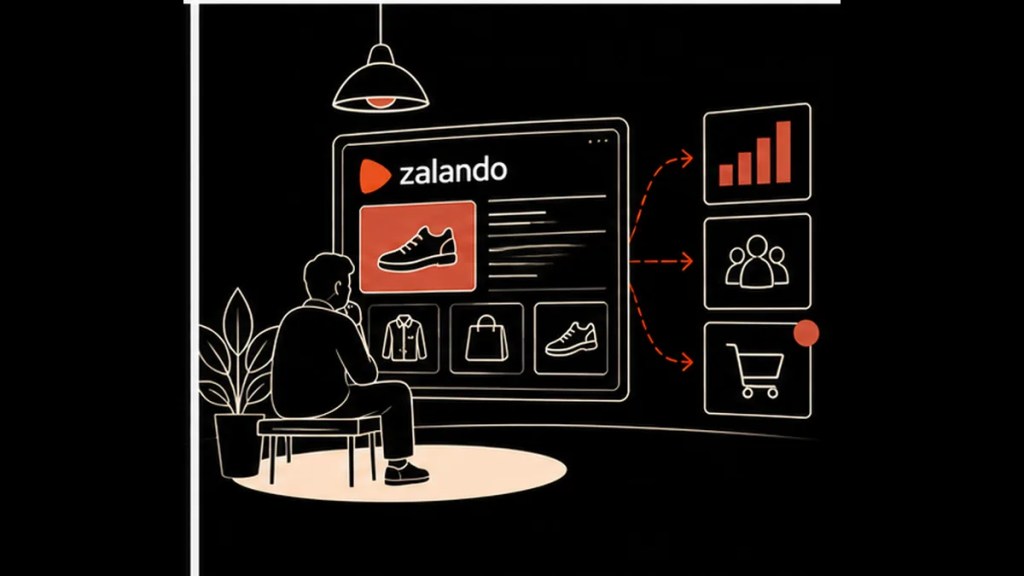
Experiment summary
Zalando tested daily algorithmic pricing across 12 European markets and estimates a 6% lift in profit contribution, with sales after returns statistically unchanged. Its model comparison shows why forecast accuracy alone is a poor guide to pricing performance.
- A sale at Zalando lasts about 6.2 days, but its pricing forecast updated weekly and each decision took hours.
- The new system forecasts demand daily and picks discounts with an optimiser that balances sales value against long-term profit.
- Zalando split products, not shoppers, across 23 A/B tests in 12 markets, so nobody saw two prices for the same item.
- Profit contribution rose an estimated 6% (95% credible interval 0.79% to 11.03%), with revenue and sales after returns statistically unchanged.
- The preprint is company-authored, not replicated, and withholds absolute figures and most country results.
Zalando’s pricing team had two demand forecasters and one pricing optimiser. A forecaster is a model that predicts how many units a product will sell at each discount level. The first was trained to minimise average error, a setup called mean-squared-error loss. It ran optimistic, and the prices the optimiser chose delivered materially less than it projected. The second used a different training rule, called Tweedie loss. It forecast more cautiously and landed closer to what it had promised.
That comparison sits inside a company-authored preprint submitted on June 11, 2026. It describes how Zalando replaced weekly sale pricing with a daily system and tested it in 23 A/B tests across 12 European markets.
Zalando estimates a 6% increase in profit contribution, while its tests found no statistically clear change in sales after returns. The modelling comparison offers a second finding: forecasting accuracy alone did not tell the team which model would lead to better pricing decisions.
Why a six-day sale broke weekly pricing
A sale at Zalando lasts 6.2 days on average, and sales campaigns fill about 35% of its year. The old pricing system updated weekly. It forecast demand and costs for possible discounts, then chose a markdown between zero and 70%, using a Transformer model with weekly resolution. During sales, discounts ran five percentage points deeper than on other days, uploads came more often and discounts varied more. A weekly forecast could miss a demand jump that arrived and faded inside one campaign.
Analysts filled the gap by hand. They combined algorithmic runs, manual adjustments and rules built around target discount levels. Revenue and long-term profit shaped those choices, but neither was an explicit goal in a single optimisation problem. A decision took hours. The paper’s abstract says the new system now makes most of the algorithmic pricing decisions for Zalando’s sales campaigns, across more than 5 million products.
What the test found
| Measure | Estimate | 95% credible interval |
|---|---|---|
| Profit contribution | +6% | 0.79% to 11.03% |
| Net merchandise value | +2.23% | minus 0.83% to 5.33% |
| Sales after returns | +0.56% | minus 3.10% to 4.26% |
Only the profit interval sits entirely above zero. The intervals for net merchandise value and sales after returns cross it, so Zalando reads both as unchanged. The profit interval is also wide, from under 1% to above 11%, which leaves room for a modest gain and for a large one.
How they tested it without showing shoppers different prices
A customer-level split would show two shoppers different prices for the same product at the same time. Zalando split articles into two equal groups instead. Control articles kept discounts from the old workflow with manual changes, and treatment articles received the algorithm’s. Clustered randomisation, which assigns similar products together, reduced substitution between them and balanced product traits and pre-test financial variables.
| Design element | What the paper reports |
|---|---|
| Tests | 23, run during sales campaigns in 2023 and 2024 |
| Markets | Belgium, Denmark, Finland, France, Germany, Italy, the Netherlands, Norway, Poland, Spain, Sweden and Switzerland |
| Length | Four to ten days, seven on average |
| Scale | About 200,000 to more than 1.8 million articles per wave, 6.2 million article observations in total |
| Bar to clear | Non-inferiority, meaning the new system had to match the old workflow on net merchandise value and profitability |
| Method | Difference-in-differences within each experiment, then a Bayesian hierarchical model across waves |
Matching the old workflow was enough to justify adoption, because faster decisions had value on their own. Difference-in-differences compares how treatment and control articles changed over the test, so a gap that existed before the test does not count as an effect.
A good forecast score did not guarantee good prices
The new design has two stages. A LightGBM model, a gradient-boosted tree method, forecasts demand for combinations of product, market, date and discount level. A linear-programming optimiser then picks discounts against a weighted objective of net merchandise value and long-term profit.
The team compared gradient-boosted trees, two neural approaches, a naive model and a daily version of the weekly production forecaster over 212 days between May and December 2024, covering every major sale type. Gradient-boosted trees scored best on Zalando’s internal demand and gross-merchandise-value error measures, and the neural models posted similar standard errors. The loss-function test then showed why error scores alone were thin evidence. A forecast can score well in isolation and still push the optimiser toward prices that disappoint.
Decision time fell from hours to minutes. Pricing managers keep oversight and can inspect alternative trade-offs before a discount goes live.
Germany ran far ahead of the pooled number
Germany reported 16.7% more profit contribution, 17.9% more net merchandise value and 16.7% more sales after returns, all described as statistically significant. Zalando suggests scale and richer data may explain it. That is an inference, and the test did not isolate the cause.
The pooled 6% therefore hides a spread. The paper gives detailed results only for Germany, so a reader cannot see where the other eleven markets fall. For a retailer rolling one pricing system across countries, the useful number is the per-market range, and the hierarchical model is built to produce it.
What revenue and pricing teams can test
For retailers running short promotions, the transferable experiment is to compare pricing decisions against profit and sales outcomes, rather than choosing a forecasting model on prediction error alone.
- Write the financial objective down and add a guardrail on the existing business, such as sales after returns.
- Judge each forecaster by the discounts it produces after optimisation, not by its standalone error score.
- Randomise products in clusters when shoppers must see one price per item.
- Pool markets with a hierarchical model and ask for the per-market estimates.
- Keep a named human owner for the revenue and profit trade-off.
The paper does not disclose absolute profit, revenue or discount levels, and detailed country results are available only for Germany. That limits what another retailer can calculate about implementation economics or likely returns in its own markets. Zalando’s results also remain unreplicated outside the company.
FAQ
How did Zalando test pricing without showing customers different prices?
It randomized articles instead of shoppers. Control articles kept discounts from the previous workflow, treatment articles received the algorithm’s discounts, and clustered randomization reduced substitution between similar products.
What was the result?
Across 23 tests, profit contribution rose an estimated 6% (95% credible interval 0.79% to 11.03%). Net merchandise value rose 2.23% and sales after returns 0.56%, but both intervals included zero, so those are treated as statistically unchanged.
Why did Zalando pick a gradient-boosted model?
LightGBM performed best on Zalando’s internal error measures, and the team also checked what happened after the optimiser used each forecast. A mean-squared-error model was optimistic and delivered less than projected, while a Tweedie loss model matched outcomes more closely.
What does the paper not disclose?
It withholds absolute profit, revenue and discount levels, and gives detailed results only for Germany. The model also omits explicit cross-price elasticity and demand uncertainty, and the work has not been independently replicated.
Sources and limits
- Zalando’s high-frequency pricing preprint, submitted June 11, 2026
- Zalando’s official company overview
- Lead author Stefan Birr’s LinkedIn profile
Zalando employees produced the experiment and paper, and one co-author was affiliated with Databricks when it was written. The results have not been independently replicated. The paper reports modeled relative effects and intervals but withholds absolute commercial outcomes, full market-level results and the exact discounts assigned to treatment and control articles.
Spotted an error? Contact the desk. Our corrections policy explains how we handle corrections and updates.
Find the reported method, result and limitations of other experiments in the Growth Signal Index in IC Lab.